Being a professional trader involves understanding various graphs and tools to predict market trends better. One such tool that stands out in differentiating short-term bulls from bears is the candlestick chart. This chart provides an informative, visual representation of stocks or forex prices and can potentially predict future market trends. Through this article, we will explore candlestick charts and their use in trading. Keep reading!
Understanding Candlestick Charts in Trading
Candlestick charts originated in Japan in the 18th century. They represent a unique way to visualize price fluctuations in a market over a specific time. While these charts might seem complex initially, they can provide valuable insights into the market when understood properly.
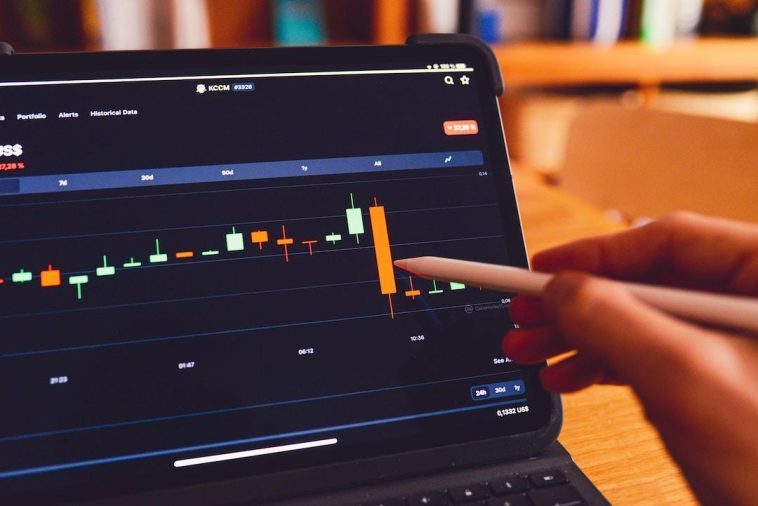
A candlestick chart essentially depicts the high, low, opening, and closing prices of a specific period. Every single ‘candlestick’ comprises a body and wicks or shadows representing the price range within a specified time frame.
While the body illustrates the range between the opening and closing prices, the shadows represent the low and high prices in that period. Colored indicators, usually red and green, differentiate a bearish from a bullish market.
Once you master the art of interpreting candlestick charts, it becomes easier to anticipate market conditions and time your trades.
Importance of Candlestick Charts for Successful Trading
Candlestick charts in trading aren’t trendy without a reason. Their popularity lies in the wealth of detail they carry. These charts show four price points for each interval, making it possible to explore various trading strategies.
Unlike line or bar graphs, candlestick charts provide an in-depth look at market psychology. They facilitate the understanding of market sentiment. For example, an extensive body signifies a strong buying or selling pressure, while short bodies depict little price movement and hence consolidated markets.
Breaking Down the Components of a Candlestick Chart
Diving deep into the structure of a candlestick chart, we can distinguish two significant parts. The visually descriptive ‘candlestick’ is composed of a rectangle and lines above and below it, known as wicks or shadows.
The body demonstrates the opening and closing prices. If the closing price is higher than the opening, the body is usually white or green, indicating a bullish candlestick. Conversely, if the closing price is below the opening price, the body is typically black or red, depicting a bearish candlestick.
The shadows or wicks, on the other hand, represent the high and low prices for the period. A candlestick with a long upper shadow and brief lower one suggests that buyers bid the price up before sellers took over and drove prices down.
Knowing these chart structures allows traders to interpret market trends and potential reversals better, thus making more informed trading decisions.
Various Patterns in Candlestick Charts
Candlestick patterns offer substantial information about price patterns. This knowledge can help traders anticipate future market trends. Let’s consider two basic optical models: bullish and bearish.
A ‘bulldoze’ or ‘hammer’ pattern typically signals a price level where buyers enter the market in strong numbers and absorb the sellers. This intervention often results in a price increase, indicating the potential start of a new upward trend.
These patterns, among others, can significantly improve the ability of traders to predict future price movements, giving them a competitive edge.
Overall, candlestick charts provide an intuitive graphical representation of price movements, enabling traders to anticipate potential market trends. By integrating these charts into your trading strategies, you can optimize your trading decisions and augment your investment portfolio.

